Building LCA benchmarks – BREEAM UK New Construction 2018
As explained in the article Why building LCA?, The Green Guide to Specification is being replaced by building LCA as the primary way environmental impacts from construction products are assessed in BREEAM. Building LCA in BREEAM UK New Construction 2018 involves two different but complimentary approaches: ‘Comparison with the BREEAM LCA benchmark’ and ‘Option Appraisal’.
This article introduces the technical detail behind ‘Comparison with the BREEAM LCA benchmark’. It provides BREEAM users with the knowledge they need to understand and explain the background to clients and others, and to leverage maximum value. The following themes are covered: –
- The reason for using the net internal area (NIA) and BRE EN ecopoint based unit
- How the benchmark impact values (known as ‘benchmarks’) are generated for each building use type
- The credit scale used to determine credit awards in the Mat 01 issue
- General guidance on reducing impacts to gain a better credit award
- Ensuring the scope of what is included in the building LCA is fair and doesn’t penalise the project
The primary purpose of ‘Comparison with the BREEAM benchmark’ is to provide a means to assess performance quantitatively. The following section introduces why that is important.
Quantitative assessment – Why is it important?
Quantitative methods are an important aspect of assessing sustainability performance in buildings. As the saying goes, ‘you can’t manage it if you don’t measure it’. When a numerical value is available for something, the ability to understand, control and communicate improvements on it is simpler and more compelling.

To assess performance quantitatively in building LCA, a suitable environmental impact indicator is measured (e.g. Kg CO2/m2 or BRE EN ecopoints/m2) and then compared with a reference value for that indicator (e.g. 10 BRE EN ecopoints/m2). A reference value is more widely trusted if it is determined:-
- In advance of an assessment so it cannot be influenced by it, and
- By an independent party who have an interest in setting something challenging but achievable.
The reference value may be specific to one building only (e.g. a ‘baseline’ that the project decides represents standard practice), or it may be a constant value for use on a range of similar buildings (e.g. a ‘standard’ or ‘benchmark’).
- Using a constant reference value is the most effective way of directly comparing the performance of several buildings to each other, e.g. to show which performs best or to rank them.
In the UK NC 2018 Mat 01 issue, ‘Comparison with the BREEAM LCA benchmark’ awards credits based on a quantitative assessment method that follows the above three bullet points. A constant reference value ‘benchmark’ is set in advance by BRE – an independent organisation operating sustainability certification schemes that aim to impartially compare, recognise and reward the performance of different buildings.
The Net Internal Area and BRE EN ecopoints based unit
The benchmarks use the BRE EN ecopoint (BRE Ep) indicator (explained below) and are expressed as BRE EN ecopoints per m2 net internal area (over a sixty-year study period life cycle). For example, a benchmark of 3 BRE EN Ep / m2 NIA means every square metre of net internal area will, on average, account for 3 ecopoints of environmental impact in total from the construction product supply chain; transport; construction; 60 years of maintenance and repair; and end-of-life disposal.
Net internal area
The benchmarks are expressed per m2 of net internal area (NIA). NIA is closely linked to the useable space that the building delivers for the functions it is intended to provide. Unlike gross internal floor (GIA) NIA excludes service areas, circulation areas, internal structures, plant rooms, WCs and all car parks (the full list can be found here). This allows buildings that are more efficient in terms of the usable space to be recognised, as demonstrated below.

BRE EN Ecopoints
An environmental indicator provides an indication of the contribution made to an environmental issue, for example, global warming potential (GWP, measured in Kg CO2 eq) is a common indicator for climate change. As stated above, an environmental impact indicator is required to carry out a quantitative assessment. Several potential indicators are available in building LCA tools (e.g. CO2e, m3 water use, BRE EN ecopoints etc.) and it is possible to carry out quantitative assessment on several at once. However, complexities arise when, for example, building A does well against indicator X and building B does well against indicator Y. Which indicator is more important and by how much; which building is better? On the other hand, if only one indicator is used, assessments and comparisons may be too limited with other environmental impacts unrepresented by the chosen indicator and therefore overlooked. In the worst case, motivation to perform well on the chosen indicator may even lead to the unintended consequence of increased environmental impacts overall.
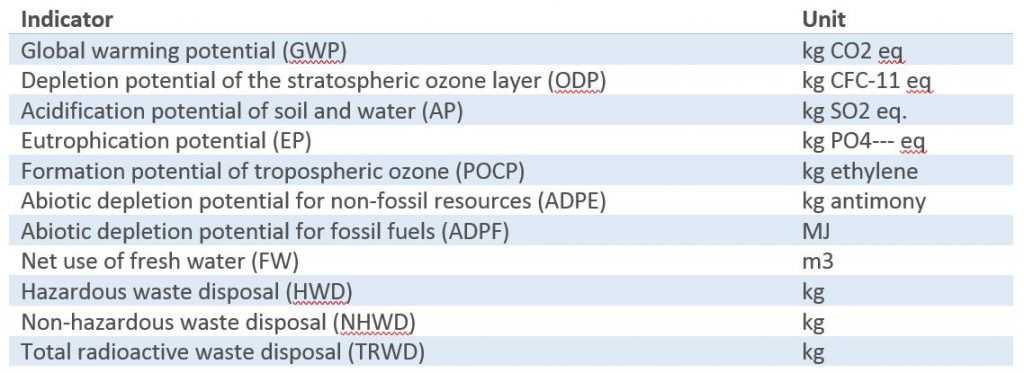
In response to this problem, BRE uses ‘BRE EN ecopoints’ (BRE Ep) which summarise a holistic range of different indicators as follows: –

To get the balance right in the makeup of ecopoints, a group of external experts vote on the relative importance of each environmental issue and the outcome is used to weight each component indicator. So, if the result of an assessment for building A is 3 BRE Ep/m2 NIA and building B is 6 BRE Ep/m2 NIA, building A is twice as good as building B across a balanced range of indicators.
How the benchmark impact values are generated
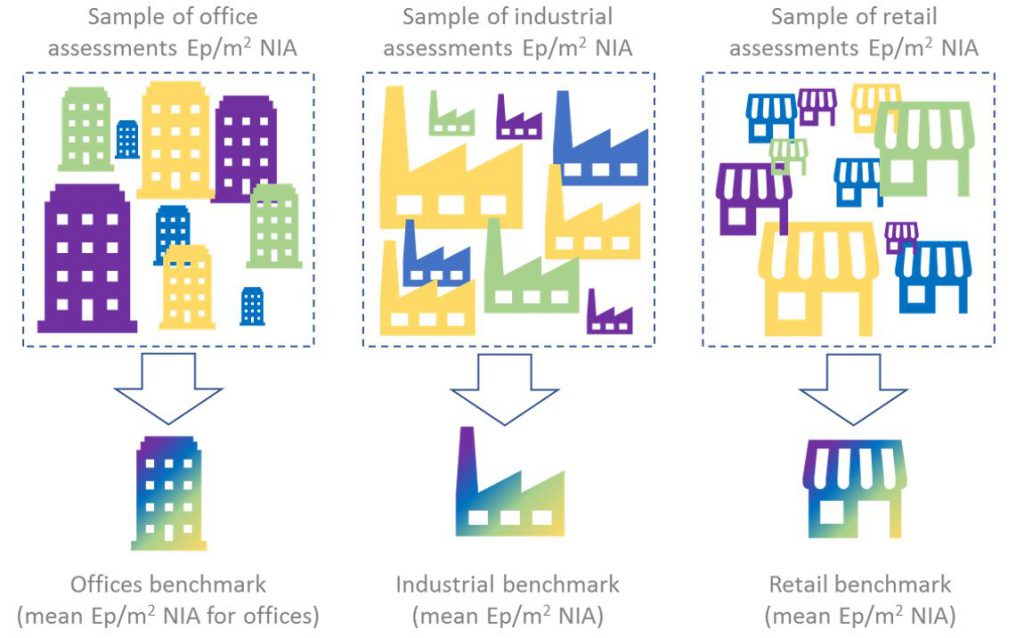
The benchmarks are worked out by averaging the results (in BRE Ep/m2 NIA) from hundreds of real buildings using data submitted for the 2011 and 2014 versions of the UK New Construction scheme, as illustrated below. This is done separately for each building use type, and there are currently benchmarks for offices, retail and industrial buildings. Other building use types will have their own benchmark when sufficient submission data has been collected.

The credit scale
‘Comparison with the BREEAM benchmark’ in the UK New Construction 2018 Mat 01 issue uses the benchmark that is relevant to the building use type under assessment. (Where no benchmark exists for the building use type, this part of the Mat 01 issue is not possible, and all the credits are transferred to ‘Option appraisal’.)
Where it is possible, credits are awarded based on how much better the building’s LCA result is compared with the benchmark. The higher the percentage better the building is, the more credits are awarded.
The scale takes into account the probable real-world increase in difficulty experienced for successive improvements beyond the benchmark. For example, the number of projects that achieve 10-20% better than the benchmark is going to be far more than achieve between 40-50% – because it is much easier to achieve the former than the latter. To account for this, the credits scale is based on a normal distribution. Also known as a ‘bell curve’, a normal distribution is widely used as the probable relationship between the distribution of observations (in this case, building LCA results) for a given variable (in this case, percentage better than the benchmark). Most assessments will cluster around the mean and the number further away will taper off markedly. To illustrate this, the following graphic shows the percentage better than the benchmark on the horizontal axis and the frequency (probable number of buildings) achieving on the vertical axis. As the percentage better than the benchmark increases, the frequency reduces according to a normal distribution curve.
This relationship is used to allocate the credit award. The normal distribution curve is split up into several credit score ranges and each range contains the same frequency (probable number of buildings). Each successive score range has a higher credit award that the last. For example, if the arrows show the percentage better than the benchmark achieved by assessment A, B and C, the number of credits awarded for B and C is higher than for A but the credit award for B and C is the same.

Future development of the benchmarks and scale
As stated above, the benchmarks are based on a real assessment data sample collected from the BREEAM UK New Construction 2011 and 2014 schemes – the best data available. However, it is recognised that the current data sample is not likely to be perfect and as such benchmarks based on it will need to be reviewed as data quality improves. To enable this, data from the UK New Construction 2018 scheme will provide more detail and will likely be more representative than data from the older schemes. With this mind, the benchmarks may well change in subsequent updates to the scheme as we gather more data from new assessments. Future changes are likely to include refinements to the existing benchmark values and may also require the splitting of an existing building use type benchmark into two or more subtype benchmarks, if statistical analysis requires it.
To reflect this the current allocation of credits for ‘comparison with the BREEAM benchmark’ is lower than for ‘option appraisal’. As the benchmarks mature, this balance may be adjusted.
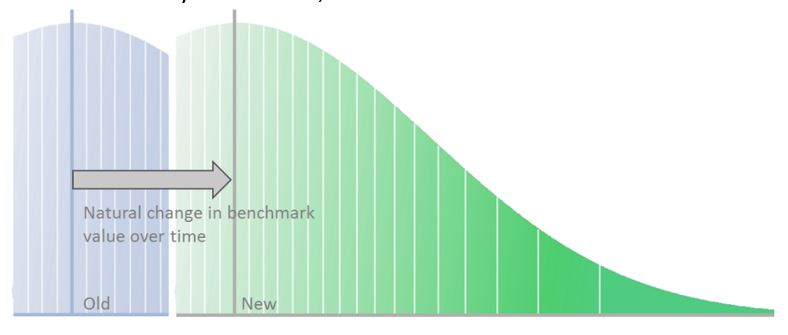
In addition, improvements in the performance of buildings over time, resulting from the increasing use of building LCA as a design tool, will be captured by future assessment submissions and added to the data sample. As a result, benchmarks will become gradually more challenging – but in line with what the industry can achieve, as illustrated below.

Guidance on reducing environmental impacts
The flexibility of building LCA accommodates the fact that all buildings are different with specific project requirements and site constraints. The flipside of this flexibility means it can be difficult to know where to start looking for lower impact solutions. Compared with experienced building LCA users, those new to building LCA may feel the process is rather ‘trial-and-error’ and therefore off-putting.
Although it is impossible to give specific advice that will apply to all projects, the BRE article ‘Getting Results With Building LCA’ is intended to provide new building LCA users with somewhere to start. It introduces the following key areas, many of which need to be considered at an early stage of the design process, and go well beyond product selection alone: –
- Focus on the ‘hotspots’
- Resource consumption (e.g. excessive material quantities for the required function; or inefficient usable floor area to gross floor area and/or the envelope area ratio)
- Alternative construction product selection
- Substructure design with regards to the local geology
- High-rise vs low-rise
- HVAC and natural ventilation
Starting building LCA early in the design process
‘Comparison with the BREEAM LCA benchmark’ is a quantitative assessment method with the focus on the outcome rather than process, so there is no credit penalty for carrying it out later at technical design rather than at concept design. However, leaving building LCA until later stages significantly reduces the opportunity it provides to reduce environmental impacts, with the result that the credit score achieved is likely to be lower than if started earlier.
Ensuring the comparison scope is fair
Comparison with the BREEAM benchmark will only be accurate and fair if the scope of construction elements included in the building LCA (of the building under assessment) is the same as the scope used when producing the benchmark. If out of scope elements are included, or in scope elements are missing, then the comparison is unfair. Moreover, including out of scope elements will mean the building will appear to be performing worse than it really is – leading to confusion and frustration.
To ensure the comparison is fair and accurate, care should be taken to ensure only in scope elements are included. This can be done by modelling only the required elements or, if additional elements are modelled for other reasons, ensuring they are correctly classified in the building LCA tool (so they are ignored by the Mat 01 Results Submission Tool).
The in scope elements are listed in the ‘scope of assessment’ section of the UK New Construction 2018 Mat 01 issue using the widely used RICS New Rules of Measurement classification system. In addition, for clarity, out of scope elements are also listed in the additional information section.
Other articles and sources of information on building LCA in BREEAM
The following compliment this article by provide further information on a range of related subjects (some have already been mentioned in this article).
Why building LCA? This article explains why BREEAM has introduced building LCA
Getting Results With Building LCA This article explores ways to reduce impacts using building LCA.
Credit score ready ready-reckoner A tool to assist users early in the process to determine what they need to do to achieve different credit award levels.
BREEAM UK New Construction 2018 Mat 01 compliance notes This resource provides clarifications on the requirements and guidance on how to comply with BREEAM if specific situations arise on a project.
Video tutorials These links are to video tutorials on how to use the BREEAM UK New Construction Mat 01 Results Submission Tool and Simplified Building LCA tool.
Time critical BREEAM requirements BREEAM’s interpretation of concept design and technical design with detailed guidance on determining what stage a project has reached.
